Live Chat
 Help Center


Google may be known for creating some great products, then killing them off right as they are coming into their own, but they are also known for creating some great web-based products to help people with their websites. Take Google PageSpeed Insights, for example. One of the few products Google’s created that doesn’t require you to sign in or give it any information, other than a URL and for free, PageSpeed Insights analyzes the content of a web page and spits out suggestions to make the page faster.
Sounds pretty cool, right?
With the dominance of Google Search and their “secret formula” for making it to the top of the SERP, let alone the first page, I mean, what is a better way to ensure you are doing everything you can to get to the top than by making recommendations on making your site faster from a utility developed by the same company?
In this blog, we’ll be covering exactly what the Google PageSpeed Insights tool does and how it can help you improve the performance of your website by using the recommendations the tool makes!
Let’s dive in!
Everything You Wanted To Know About Google PageSpeed Insights Tool
Table of Contents
- Everything You Wanted To Know About Google PageSpeed Insights Tool
- What is the Google PageSpeed Insights Tool?
- What does Google PageSpeed Insights measure?
- Opportunities (For Improvement)
- Eliminate render-blocking resources
- Properly Size Images
- Defer offscreen images
- Minify CSS
- Minify JavaScript
- Remove Unused CSS
- Efficiently encode images
- Serve images in modern formats
- Enable text compression
- Preconnect to required origins
- Reduce server response times (TTFB)
- Avoid multiple page redirects
- Preload key requests
- Use video formats for animated content
- Reduce the impact of third-party code
- Avoid non-composited animations
- Lazy load third-party resources with facades
- Does Google PageSpeed Insights affect SEO?
- How Can I Improve My PageSpeed Insights Scoring?
What is the Google PageSpeed Insights Tool?
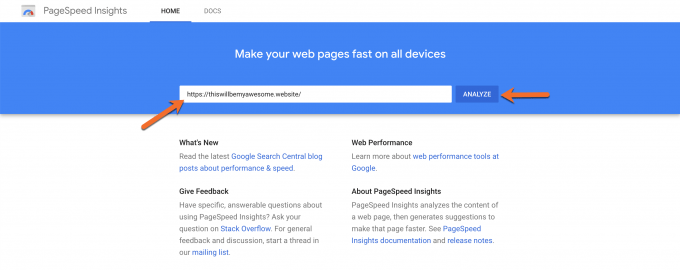
If you’re not familiar with the tool, go ahead and head over to the utility by clicking here. Once the page loads, insert any URL you want into the field and click the analyze button.
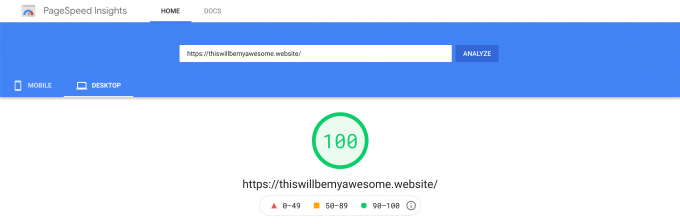
Once the analysis is complete, you’ll receive a score rated out of a possible 100 points for both Mobile and Desktop performance:
Along with the scoring, you’ll receive what are perhaps the most useful bits of information from the testing: the recommendations from Google on how to improve your website’s performance (and by extension, increase your scoring on Google PageSpeed Insights).
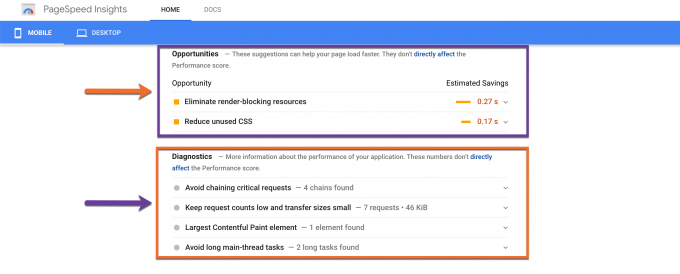
By taking these suggestions into consideration and making the necessary changes to your website, you should notice a huge improvement in scoring once you test again.
What does Google PageSpeed Insights measure?
Currently, Google PageSpeed Insights Insights scoring is generated by a tool called Lighthouse.
Lighthouse is an open-source, automated tool for improving the quality of web pages created by, yes, you guessed it, Google. The tool can be run against any web page, whether it’s public or requires authentication, and features audits for areas such as:
- Performance
- Accessibility
- Progress Web Apps (PWAs)
- Proper SEO
- and more.
Lighthouse is actually built into the Chrome DevTools, which is probably the easiest way to run the utility, however, you can also run Lighthouse from the command line or as a Node module, if you are so inclined. Alternatively, you can use Google PageSpeed Insights Insights to run the tool, however, if you want more information, we suggest using Google Measure.
Measure is a front-end for Lighthouse and conducts a performance audit much like the one that PSI does, however, Measure also gives you scores for Accessibility, Best Practices, and Search Engine Optimization (SEO), which is super handy.
Scoring
Lighthouse takes into consideration the following metrics when running its performance audits:
- First Contentful Paint
- First Meaningful Paint
- Speed Index
- First CPU Idle
- Time to Interactive
- Max Potential First Input Delay
- Total Blocking Time
- Largest Contentful Paint
When testing using Measure or PSI, one thing to keep in mind is that a lot of variability in the overall Performance score and individual metric values is not due to Lighthouse. When your Performance scores fluctuate, it’s likely due to some underlying conditions, such as:
- A/B Testing or ads being served.
- Traffic on the internet or the path your request took on the internet.
- Testing on different devices, such as using a high-performance desktop vs a low-performance laptop.
- Browser extensions that can inject JavaScript and add/modify network requests, such as ad blockers.
- Antivirus software that scans for internet threats.
Each of these has its own weights and the metrics are determined individually.
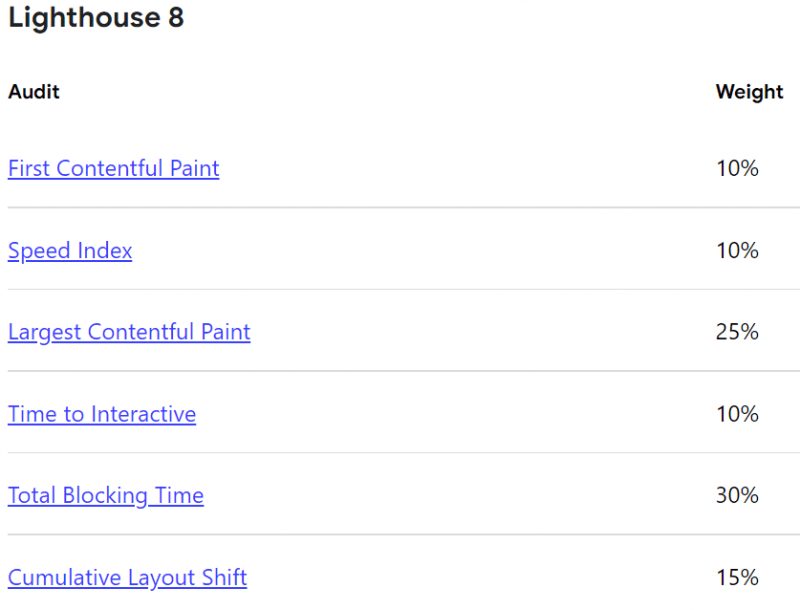
Let’s look at what each of these metrics means and how Lighthouse determines the score for each.
First Contentful Paint
FCP, or First Contentful Paint, measures how long it takes the browser to render the first piece of DOM content after a user navigates to your page. Images, non-white
Your FCP score is a comparison of your page’s FCP time and FCP times for real websites, based on data from the HTTP Archive. For example, sites performing in the ninety-ninth percentile render FCP in about 1.2 seconds. If your website’s FCP is 1.2 seconds, your FCP score is 99.
First Meaningful Paint
FMP measures when the primary content of a page is visible to the user. The raw score for FMP is the time in seconds between the user initiating the page load and the page rendering the primary above-the-fold content. FMP essentially shows the timing of the paint after which the biggest above-the-fold layout change happens.
First Contentful Paint (FCP) and FMP are often the same when the first bit of content rendered on the page includes the content above the fold. However, these metrics can differ when, for example, there’s content above the fold within an iframe. FMP registers when the content within the iframe is visible to the user, while FCP doesn’t include iframe content.
Speed Index
Speed Index measures how quickly content is visually displayed during page load. Lighthouse first captures a video of the page loading in the browser and computes the visual progression between frames. Lighthouse then uses the Speedline Node.js module to generate the Speed Index score.
Your Speed Index score is a comparison of your page’s speed index and the speed indices of real websites, based on data from the HTTP Archive.
This table shows how to interpret your mobile Speed Index score:
| Speed Index (in seconds) | Color-coding |
|---|---|
| 0–3.4 | Green (fast) |
| 3.4–5.8 | Orange (moderate) |
| Over 5.8 | Red (slow) |
First CPU Idle
First CPU Idle measures how long it takes a page to become minimally interactive. A page is considered minimally interactive when:
- Most—but not necessarily all—UI elements on the screen are interactive, and
- The page responds, on average, to most user input in a reasonable amount of time.
Your First CPU Idle score is a comparison of your page’s First CPU Idle time and First CPU Idle times for real websites, based on data from the HTTP Archive. For example, sites performing in the ninety-fifth percentile render First CPU Idle in about 3 seconds. If your website’s First CPU Idle is 3 seconds, your First CPU Idle score is 95.
This table shows how to interpret your First CPU Idle score:
| First CPU Idle metric (in seconds) | Color-coding | First CPU Idle score (HTTP Archive percentile) |
|---|---|---|
| 0–4.7 | Green (fast) | 75–100 |
| 4.8–6.5 | Orange (moderate) | 50–74 |
| Over 6.5 | Red (slow) | 0–49 |
Time to Interactive
TTI measures how long it takes a page to become fully interactive. A page is considered fully interactive when:
- The page displays useful content, which is measured by the First Contentful Paint,
- Event handlers are registered for most visible page elements, and
- The page responds to user interactions within 50 milliseconds.
The TTI score is a comparison of your page’s TTI and the TTI for real websites, based on data from the HTTP Archive. For example, sites performing in the ninety-ninth percentile render TTI in about 2.2 seconds. If your website’s TTI is 2.2 seconds, your TTI score is 99.
This table shows how to interpret your TTI score:
| TTI metric (in seconds) | Color-coding |
|---|---|
| 0–3.8 | Green (fast) |
| 3.9–7.3 | Orange (moderate) |
| Over 7.3 | Red (slow) |
Max Potential First Input Delay
Max Potential FID measures the worst-case First Input Delay that your users might experience. First Input Delay measures the time from when a user first interacts with your site, such as clicking a button, to the time when the browser is actually able to respond to that interaction.
Lighthouse calculates Max Potential FID by finding the duration of the longest task after First Contentful Paint. Tasks before First Contentful Paint are excluded because it’s unlikely that a user will attempt to interact with your page before any content has been rendered to the screen, which is what First Contentful Paint measures.
Your Max Potential FID score is a comparison of your page’s Max Potential FID time and Max Potential FID times for real websites, based on data from the HTTP Archive. For example, if your Max Potential FID score in Lighthouse is green, it means that your page performs better than 90% of real websites.
This table shows how to interpret your TBT score:
| Max Potential FID time (in milliseconds) | Color-coding |
|---|---|
| 0–130 | Green (fast) |
| 130-250 | Orange (moderate) |
| Over 250 | Red (slow) |
Total Blocking Time
TBT measures the total amount of time that a page is blocked from responding to user input, such as mouse clicks, screen taps, or keyboard presses. The sum is calculated by adding the blocking portion of all long tasks between First Contentful Paint and Time to Interactive. Any task that executes for more than 50 ms is a long task. The amount of time after 50 ms is the blocking portion. For example, if Lighthouse detects a 70 ms long task, the blocking portion would be 20 ms.
Your TBT score is a comparison of your page’s TBT time and TBT times millions of real sites when loaded on mobile devices.
This table shows how to interpret your TBT score:
| TBT time (in milliseconds) | Color-coding |
|---|---|
| 0–200 | Green (fast) |
| 200-600 | Orange (moderate) |
| Over 600 | Red (slow) |
Largest Contentful Paint
LCP measures when the largest content element in the viewport is rendered to the screen. This approximates when the main content of the page is visible to users. See Largest Contentful Paint defined for more details on how LCP is determined.
Browser support for LCP launched in Chrome 77. Lighthouse extracts LCP data from Chrome’s tracing tool.
The table below shows how to interpret your LCP score:
| LCP time (in seconds) | Color-coding |
|---|---|
| 0-2.5 | Green (fast) |
| 2.5-4 | Orange (moderate) |
| Over 4 | Red (slow) |
Opportunities (For Improvement)
If the scoring comes back showing your site needs improvement, you will see a section called Opportunities appear with suggestions on what to do:
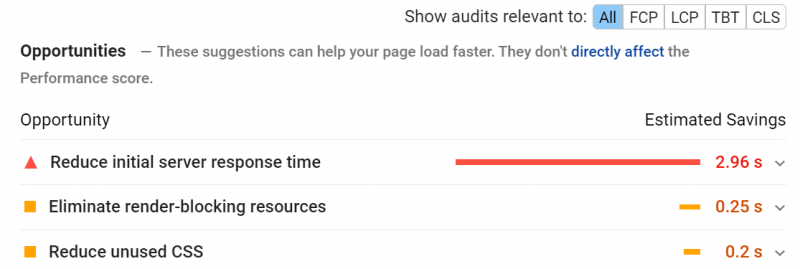
There are 17 Opportunities that can be given, depending on the results. Because not all of them will show on every website, we’ve prepared a list below, along with details on what each of the Opportunities is below:
- Eliminate render-blocking resources
- Properly size images
- Defer offscreen images
- Minify CSS
- Minify JavaScript
- Remove unused CSS
- Efficiently encode images
- Serve images in modern formats
- Enable text compression
- Preconnect to required origins
- Reduce server response times (TTFB)
- Avoid multiple page redirects
- Preload key requests
- Use video formats for animated content
- Reduce the impact of third-party code
- Avoid non-composited animations
- Lazy load third-party resources with facades
Eliminate render-blocking resources
If the Opportunities section of your report lists all URLs blocking the first paint of your page, then the goal is to reduce the impact of these render-blocking URLs by inlining critical resources, deferring non-critical resources, and removing anything that isn’t used.
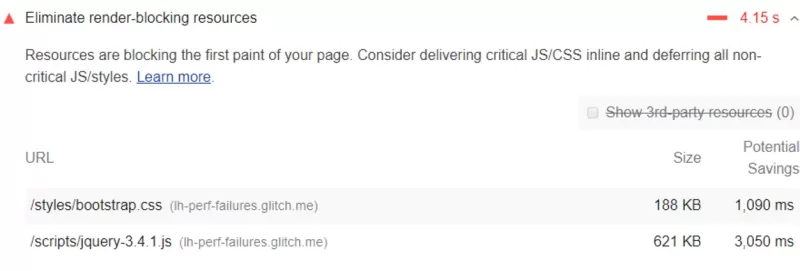
As we’ve mentioned, these results are generated by the Lighthouse application. Lighthouse flags just two types of render-blocking URLs:
- Scripts
- Stylesheets
If one of the following is true for your